Schools, Data and Dashboards - Microsoft Power BI
Schools and academy trusts that want to use the data they collect to raise teaching quality and improve learner outcomes may face particular challenges:
-
Schools generate a serious amount of data - marks, attendance records, exam grades, output from lesson observations etc. Sifting through all that data and finding the value isn’t always straightforward.
-
Data is often stored across multiple systems - that often makes reporting difficult.
-
Many schools are now in Multi-Academy Trusts (MATs) - it’s even harder to get a joined up picture of what’s going on. Data may even be in different systems in different schools.
-
Schools have to report to trustees, governors and other statutory bodies - reporting requirements that create additional pressures and perhaps don’t leave time for using data in more innovative and strategic ways.
Microsoft Power BI is a good way forward. Power BI is a powerful suite of business intelligence tools - a low cost solution, it is easy to get to grips with and it gives schools all the tools they need to create and share interactive data dashboards.

How should a school that’s interested in Microsoft Power BI get started? Here are some suggestions:
-
Get someone in your team to download Microsoft Power BI Desktop - start building in-house expertise.
-
Start by building a simple report that uses data in MS Excel (perhaps you can export data from your management information system as a .csv file and then save it as an Excel file).
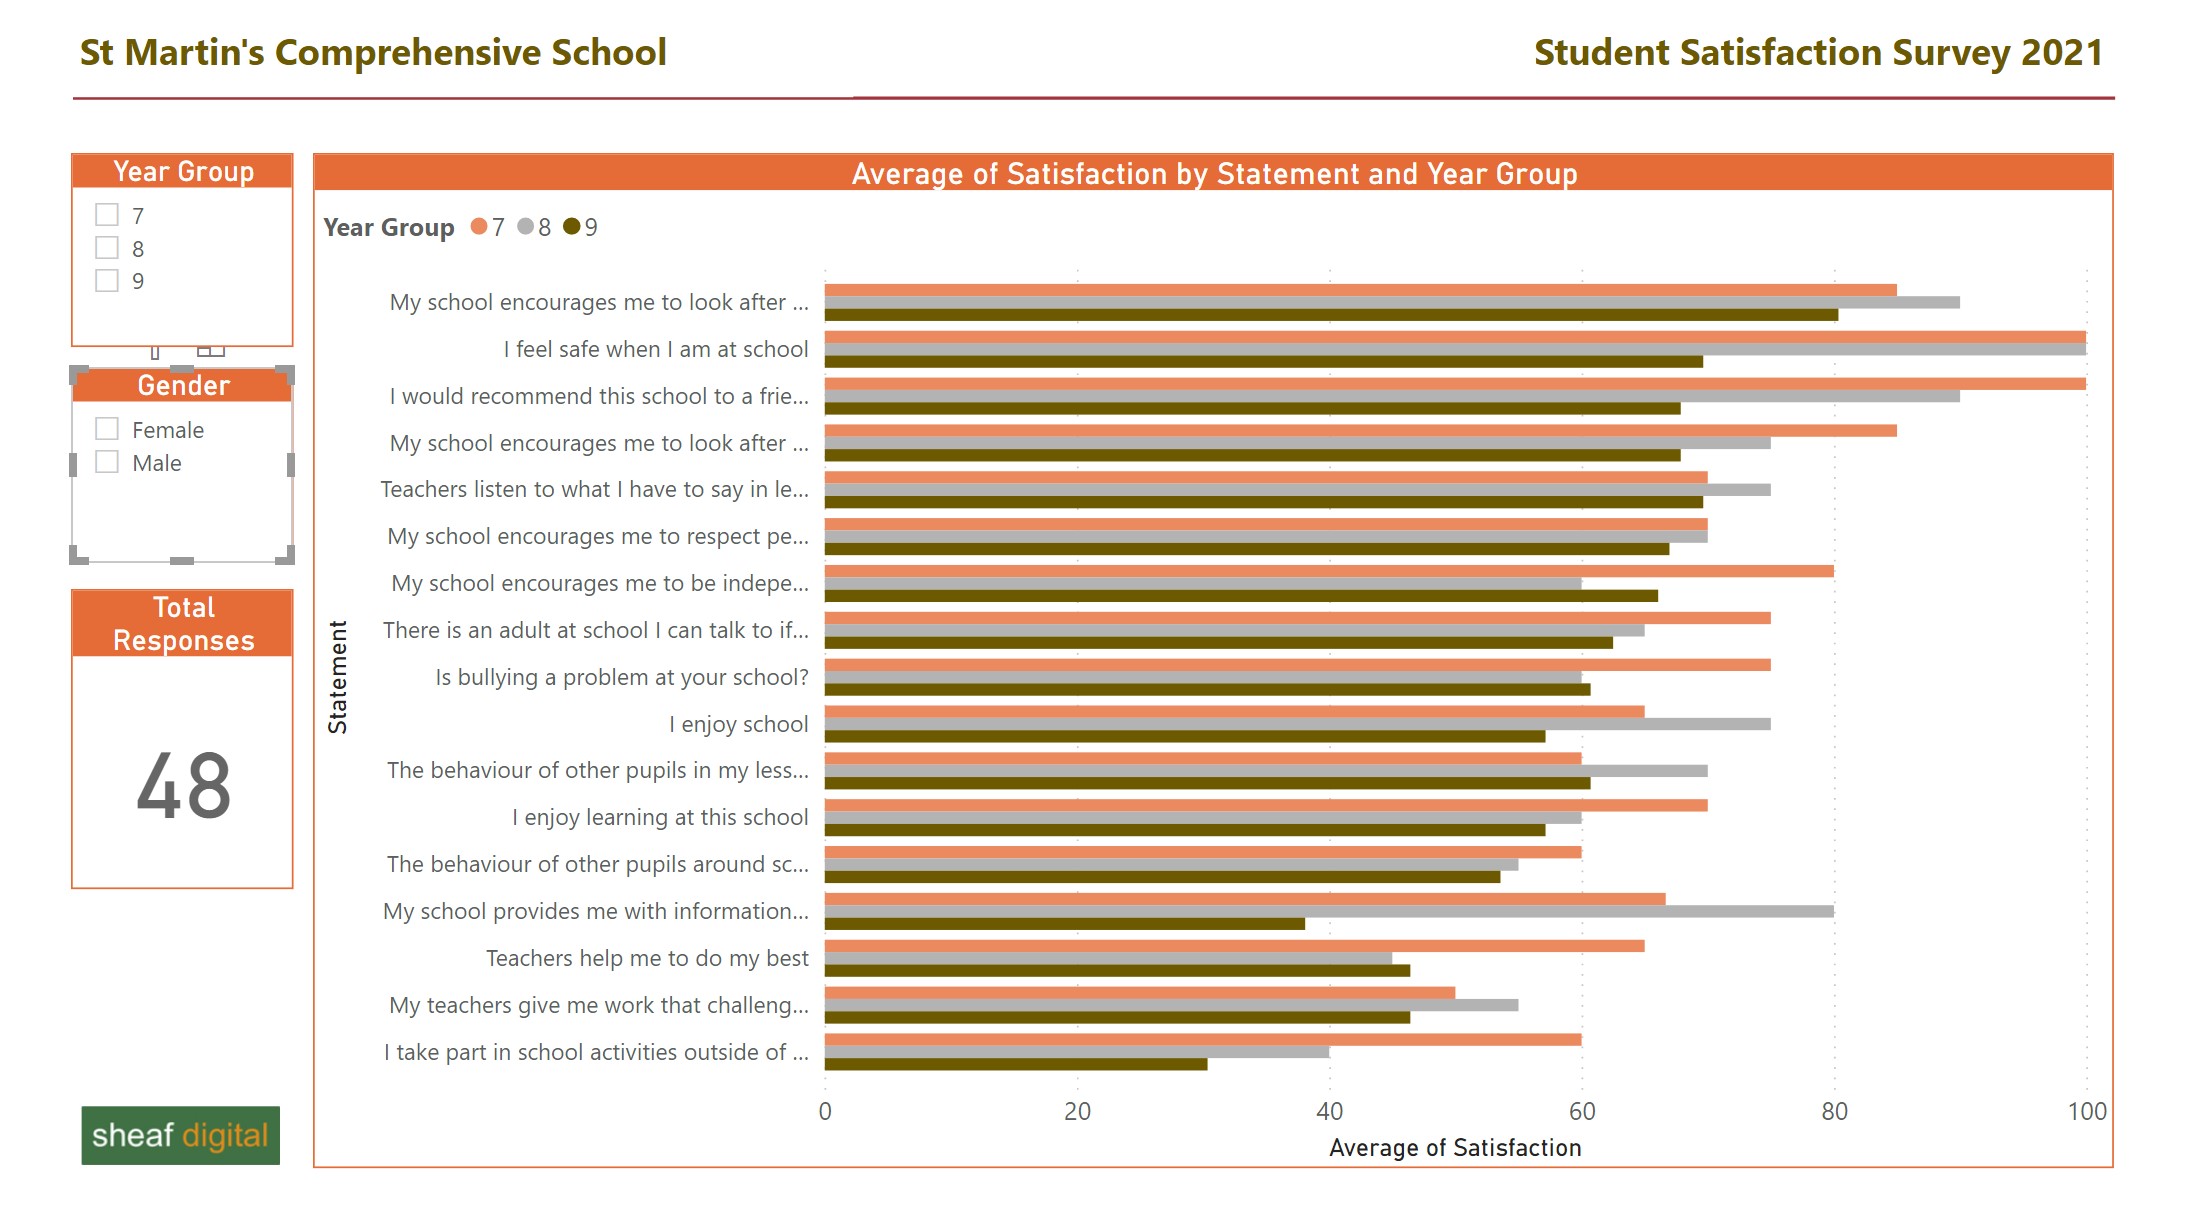
Our blog post about how to use Power BI to build a simple interactive student satisfaction report is a good introduction to building reports in Power BI with data from MS Excel. It highlights the importance of the format of your data - a simple, flat Excel table - and why you should keep report design as simple as possible.
-
A good next step goal would be to create a report that uses data from your management information system.
Some MIS vendors - for example Bromcom and Arbor - can give customers access to a data warehouse so they can build Power BI reports that use MIS data. When complete, the Power BI report can be shared with colleagues using the online Power BI service and configured to refresh automatically each night.
Perhaps you want a better view of KS2 attainment across all schools that you can then share across your trust? Or you want to do some analysis why learners seem to underperform in some areas but not others? With data from your MIS you can build - and it takes time - sophisticated multi-page reports that allow comparisons between schools in a trust, tracking over time of students during the year and fine grained analysis of different groups of students - for example students who are eligble for free school meals or receive the pupil premium.
Our blog post about how to develop a simple student performance report is a good place to start if you want an introduction to Power BI reports that use assessment data.

The post explains how relations between tables work and includes some simple measures that calculate current attainment vs expected attainment.
Sheaf Digital can help you develop Power BI reports and begin to build capacity in your team. In addition to our Power BI in Schools consultancy service, we also provide Power BI training for schools, colleges and other organisations that want to build in-house capacity.
Power BI in Schools
Our bespoke support and training for schools and MATs that want to leverage the full potential of Microsoft Power BI.
Related Posts
What's the difference between measures and calculated columns in Microsoft Power BI?
Visualising school performance in Microsoft Power BI
Looking for insights - Pearson Correlation and measures in Microsoft Power BI
Scatter Plots, School Performance and Microsoft Power BI
Power BI Cumulative Totals and Measures - Course Sales Pipeline
Slicer visualization in Power BI - filtering by date with help from a simple measure