What's the difference between measures and calculated columns in Microsoft Power BI?
Power BI calculated columns and measures can be confusing at first - they seem to do almost the same thing. In the following example we use some simple school attendance data to explain why calculated columns and measures are different and we show you which one to choose when you want to do more analysis of your data.
What is a Power BI calculated column?
Let’s start with some dummy data. It’s an Excel table of data about school attendance. Each row in the table is attendance data for a particular class on a particular day.
The data is really simple:
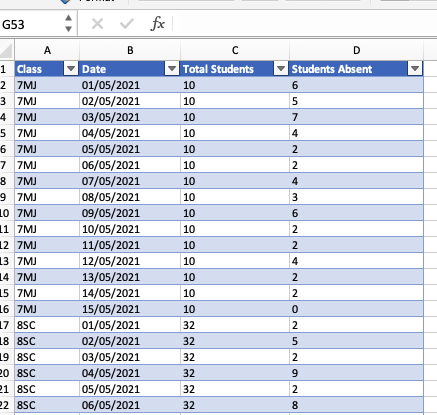
We know the total students for the class and we know many were absent on each day.
What if we wanted to know how many students were at school on each day? That’s just a simple calculated column in Power BI. Here’s how we do it.
-
Right click your data table and add a new column.
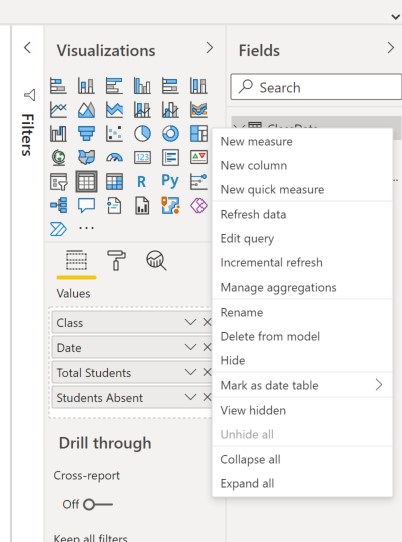
-
Enter this expression into the formula bar.
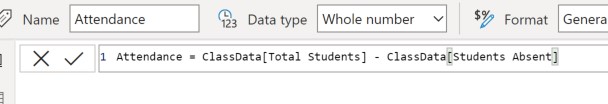
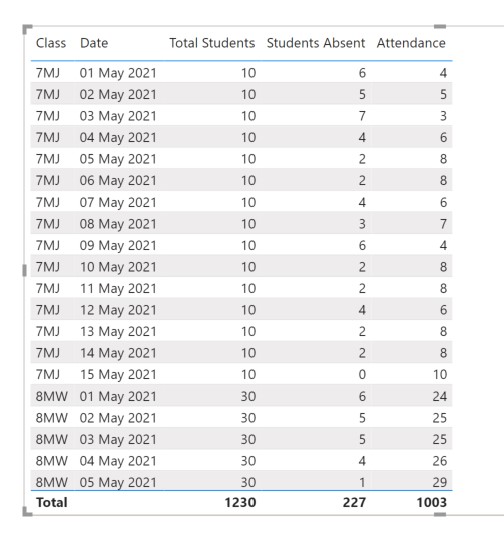
You can now add your new column to the table visualisation. Now you can see the number of students in attendance on each day. And, the default table footer row will give you the total attendance across all the classes and dates.
There are some key things to know about calculated columns:
-
Calculated columns are evaluated at row level.
-
They’re calculated at data refresh time - they don’t change when you interact with the visual. A calculated column effectively becomes part of your underlying data.
What is a Power BI measure?
Now suppose we want to calculate - for each row in the table - the class attendance as a %. We want to do this:
% Attendance = (Total Students - Absent Students) / Total Students
The obvious thing to do is to create another calculated column. Repeat the steps from the first example and then divide by Total Students.
This is what we get:
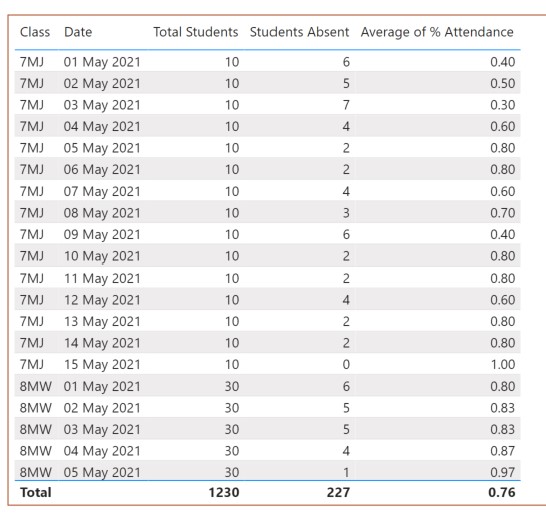
That looks ok, but there’s a problem with the calculated column approach that becomes clear when you want to see overall attendance across all the classes. Look at the Average value in the footer row at the bottom of the table. Power BI is calculating the average value of all the numbers in the % Attendance column. It’s a simple numerical average that doesn’t take into account the relative sizes of the different classes. The answer we get - 0.76 - is not the one we are looking for.
Instead, we need a calculation that works across the whole table:
Average attendance = (Total students across all classes/dates - total absences across all classes/dates)/Total students across all classes/dates
And it would be smart if our calculation worked when we change the filtering. For example, if we use a slicer and just look at attendance for 7MJ, we want to see overall or average attendance for 7MJ.
The right solution is to use a measure. This is what goes in the formula bar when we add a new measure:

Look what happens when we add our attendance measure to our table visual:
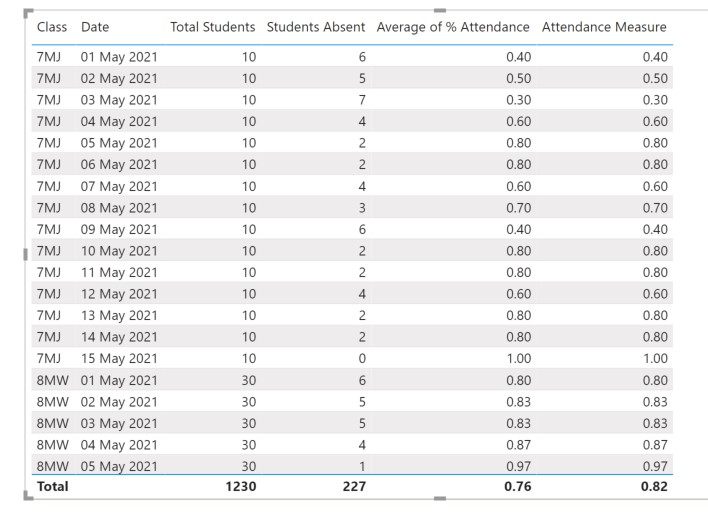
The measure is calculateing the attendance for each row in the table - we get the same numbers as the calculated column. The overall figure though is different. Now we get 0.82 instead of 0.76. The measure works on the fly. It calculates the average attendance in the context of all the visible rows (it works if filters are applied). And it calculates the attendance at row level (row level context).
These are the key things you need to know about Measures in Power BI:
-
Measures are good when you want the calculation to change when the filtering changes.
-
They’re the right thing to use when you want to calculate aggregations, ratios and weighted averages.
Measures are calculated on the fly across the rows that have been filtered or sliced.
Conclusion - Calculated Columns vs. Measures
Is there a simple rule we can use to help us decide between a calculated column and a measure?
A calculated column is usually the way to go if you want to use the result to do more slicing or filtering of your data - you could use the column in a slicer. Measures on the other hand will often give you the final values you want to see in your report - calculations you want to happen on numbers you see after you’ve filtered or sliced the data.
Related Posts
Why data analytics with Microsoft Power BI might just be great for your school
A first look at the UK HE longitudinal education outcomes dataset with Microsoft Power BI
Power BI in schools - a student performance dashboard
Slicer visualization in Power BI - filtering by date with help from a simple measure