Power BI in Schools
Bespoke school analytics
Transform the way your MAT or school collects, manages and reports data.
Leverage the full potential of Microsoft Power BI across your organisation to track student progress, identify areas for improvement and make better decisions.
Our customers
Our customers include universities, schools, FE colleges and other course providers.


Find insights in school data and share them with colleagues
We understand the challenges that multi academy trusts and schools face - they are data rich envronments with multiple data silos, but are short on time and often have limited technical resources.
Our Microsoft Power BI service for the schools sector combines technical expertise and education domain knowledge. It is tailormade to get you maximum value from Microsoft Power BI in an education context. Our service offer includes:
- Expert advice on how to organise data across different systems for simpler reporting.
Find out how to consolidate and integrate data from different systems so you can then report on that data in Power BI.
- Integration with school MIS systems like Arbor and Bromcom.
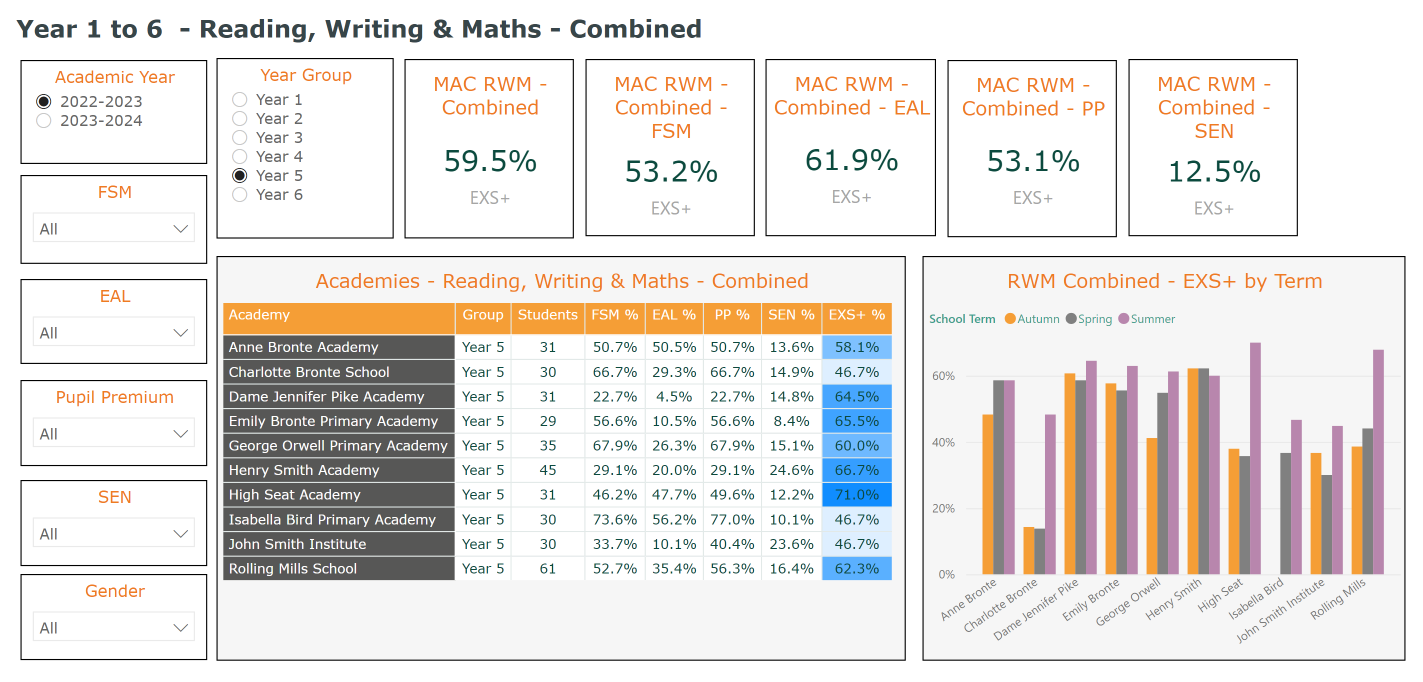
Develop reports that pull in data from across the schools in your MAT - so your central team gets a joined up view of assessment, attendance and other data.
- A fast and friendly report authoring service.
Kickstart your Power BI reports and dashboards. When we write reports for you we also explain how the reports were built - knowledge is cascaded to your team.
- Setup and configuration of the Power BI online service so you can share reports and dashboards.
Take full advantage of Power BI to create a data driven culture across your school. We show you how to use the Power BI online service to share interactive reports and dashboards with colleagues - staff, school governors and other Trust stakeholders.
- Training for school leaders, data managers and other staff.
Develop an achievable Power BI roadmap for your MAT or school. Begin authoring interactive reports and dashboards.
Projects

Microsoft Power BI Training and Consultancy - Brigantia Learning Trust
Sheaf Digital recently delivered 2 days of Power BI Training to staff at the Brigantia Learning Trust in Sheffield. The trust operates 4 academies including one post-16 college....
More
Power BI Consultancy for Schools - St Francis and St Clare
Sheaf Digital has developed a series of Power BI reports for the St Francis & St Clare Catholic Multi Academy Company (SFSCMAC) in Wolverhampton.
More
Power BI Assessment Tracker Reports for the Holy Cross MAC in Coventry
Sheaf Digital has developed a series of Power BI assessment reports for the Holy Cross Multi Academy Company in Coventry. The 5 Holy Cross primary schools use the Arbor school management information system....
More
Avanti Schools Trust - Microsoft Power Apps Case Study
The Avanti Schools Trust HR department asked Sheaf Digital to replace a paper based recruitment requisition form with a simpler, more efficient software solution....
More
Sheaf Digital Power BI Training - Chesterfield College
Sheaf Digital recently delivered 4 days of Power BI Training to two separate groups from the business support team at Chesterfield College. The training was based on our Get Started with Power BI course....
More
South Yorkshire Apprenticeship Hub - Vacancy Search
Sheaf Digital has developed a version of our Sheffield Apprenticeships vacancy search site for the new South Yorkshire Apprenticeship Hub (SYAH)....
More
A Simple Guide to Microsoft Power BI in Multi-Academy Trusts and Schools
Multi-academy trusts (MATS) face particular challenges when they try to collect, organise and then report on data....
More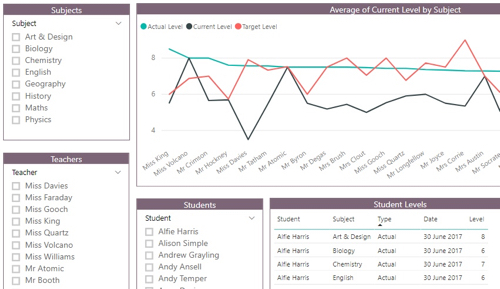
Power BI in schools - how can you report on data from multiple MIS databases?
The real challenge for any school that wants to use a tool like Microsoft Power BI to analyse and report on data is how to get at data that is spread across different application databases - you want a solution that doesn’t involve lots of copy and pasting between different spreadsheets....
MorePower BI in schools - a student performance dashboard
This is another look at how you could build a very simple Power BI report to track student performance. There are two tables of data – both imported into Power BI Desktop from an Excel Workbook. Power BI Desktop automatically joins the two tables on StudentId...
More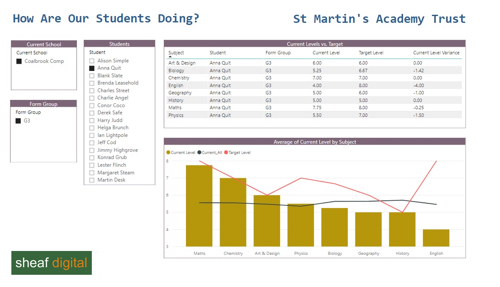
Power BI in schools - a simple way to look at student attainment
This is one way of looking at student performance in Power BI. It’s a simple report built on top of single table of data about students and how they score in assessments. Three things about the dashboard are worth noting:...
More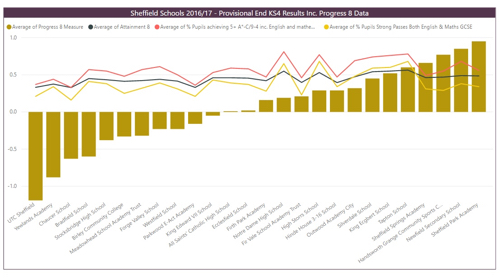
Visualising school performance in Microsoft Power BI
It’s easy to get hold of schools performance data about schools in England - data is available for download from the Department for Education website. This post uses the latest end of Key Stage data - the provisional dataset for 2016/17. You can find it here...
More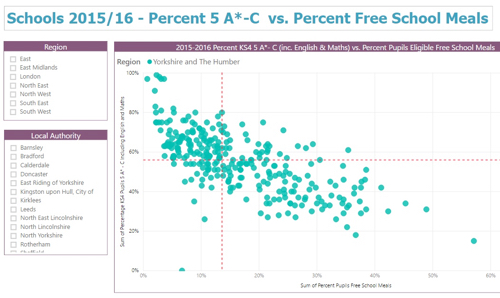
Scatter Plots, School Performance and Microsoft Power BI
A scatter chart in Microsoft Power BI a great way to the relationship between two values. You plot 2 sets of numbers as a series of xy points and then look for patterns in the data - trends, clusters and outliers....
More
Why data analytics with Microsoft Power BI might just be great for your school
You can use Microsoft Power BI to turn your in-house data into interactive data dashboards and reports. It’s now one of the top two or three business intelligence tools...
More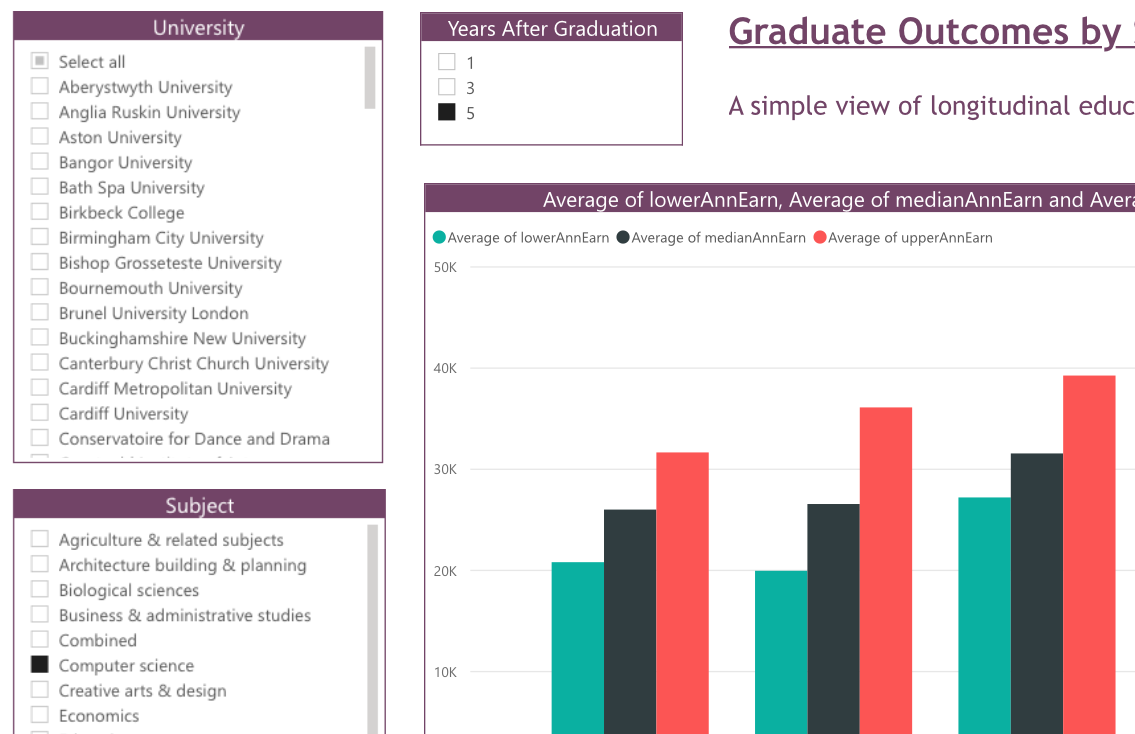
A first look at the UK HE longitudinal education outcomes dataset with Microsoft Power BI
How easy it to compare the earnings of graduates from different universities? Does a computer science graduate from Durham University make more money than one from the the University of Sheffield...
MoreThe best way to develop Microsoft Power BI reports for schools
The best Microsoft Power BI reports and dashboards are simple. They turn large sets of tabular data into user friendly, interactive visualisations that...
MoreHigh Quality Microsoft Power BI Training Courses
Find out how to build and share reports. Courses for complete beginners take you through data preparation, data loading, report design and basic calculated columns and measures. Bespoke courses can use your own data.