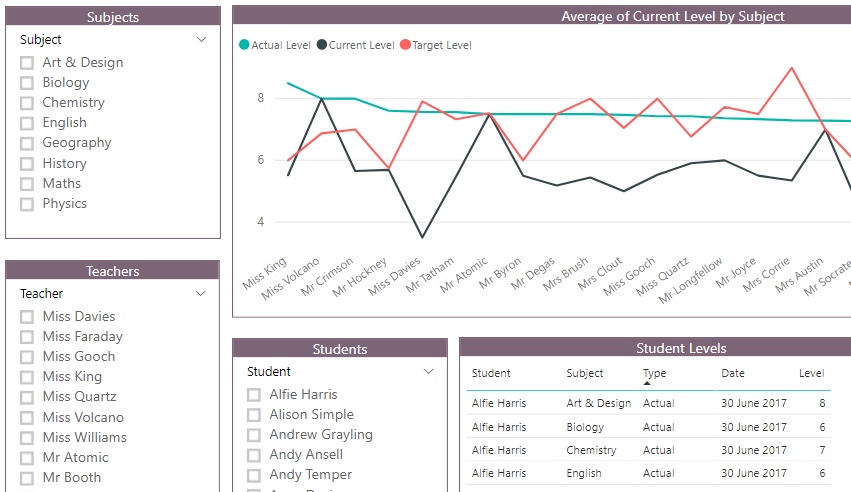
Power BI in schools - how can you report on data from multiple MIS databases?
The real challenge for any school that wants to use a tool like Microsoft Power BI to analyse and report on data is how to get at data that is spread across different application databases - you want a solution that doesn’t involve lots of copy and pasting between different spreadsheets.

In schools data is spread across student record systems, curriculum planning software, finance applications and other systems. Multi-academy trusts make the challenge even bigger - trustees want to drill into data that has come from more than one school.
How can you solve this problem? What are the technologies that can give a school an affordable, flexible and sustainable data reporting solution?
Here are three broad approaches:
Approach 1 (probably the ideal)
Key features -
-
Develop a cloud based reporting database in Microsoft Azure (Microsoft's cloud hosting solution). The database sits between your source databases and Power BI. It’s organised in a way to make reporting easier - the tables in the database give a simpler, more consolidated view of important data.
-
Use Microsoft’s data connectors to link source application databases to the reporting database. It may then be possible to do almost real-time updates.
-
Point Power BI at the reporting database - that connection is straightforward.
-
Build interactive dashboards in Power BI Desktop and share them with the online Power BI service.
Challenges -
-
It may not be possible to connect directly to some of you software application databases - your software vendor may simply not allow it.
-
A trust with say 4 schools and 3 different applications in each school needs - worst case scenario - 12 different connections; technically possible but the amount of effort required might make the solution too expensive.
Approach 2 (more manual maintenance because for some reason you can't connect directly to your source databases)
Key features -
-
Build the cloud based reporting database as in Approach 1.
-
Export data from your application databases as .csv or Microsoft Excel files.
-
Import the .csv files into the reporting database - scripts can be developed to do this automatically, whenever the .csv files are changed.
-
Point Power BI Desktop at the reporting database and build your reports.
Challenges -
- There’s a manual step in this approach. Somebody’s got to get the reports out of the source applications everytime the reporting database has to be updated.
Approach 3 (potentially spreadsheet hell but maybe a first step and good for prototyping)
Key features -
-
Don’t have a reporting database - miss this step out.
-
Export spreadsheets from your application databases and import them straight into Power Bi Desktop.
-
Build reports and dashboards in Power BI.
Challenges -
-
A lot of manual effort - takes time.
-
Using Power BI Desktop to report across multiple imported spreadsheets becomes more difficult - it is much harder to keep track of how up to date things are.
A real world solution might be a combination of all three approaches. And you’d need help from a software developer, particularly for approaches 1 & 2. A final point to make is that it totally makes sense to build a reporting solution like this in phases - start with some prototype dashboards, prioritise your data sources and add new ones over time.
Power BI in Schools
Our bespoke support and training for schools and MATs that want to leverage the full potential of Microsoft Power BI.
Related Posts
What's the difference between measures and calculated columns in Microsoft Power BI?
Visualising school performance in Microsoft Power BI
Looking for insights - Pearson Correlation and measures in Microsoft Power BI
Scatter Plots, School Performance and Microsoft Power BI
Power BI Cumulative Totals and Measures - Course Sales Pipeline
Slicer visualization in Power BI - filtering by date with help from a simple measure
