Power BI Cumulative Totals and Measures - Course Sales Pipeline
This is a nice example of how to create a measure in Power BI to calculate running or cumulative totals. It’s a refinement of a post I did on the SkillsLogic blog about using calculated columns to calculate running totals. In this example I’ve gone a step further used a measure - so the running totals change when the user applies filters to the report.
Here’s the underlying data. The context is training - I’ve created a simple sales dashboard for a training provider that sells places on courses. Each new enquiry, enrolment or record of a lost ‘sale’ is added to an Excel table as a new row. Potential new learners are identified by a Prospect_Id. The same Prospect_Id may appear in more than one row because a learner’s status may change from ‘Enquiry’ to ‘Enrolled’ or maybe to ‘Lost’.
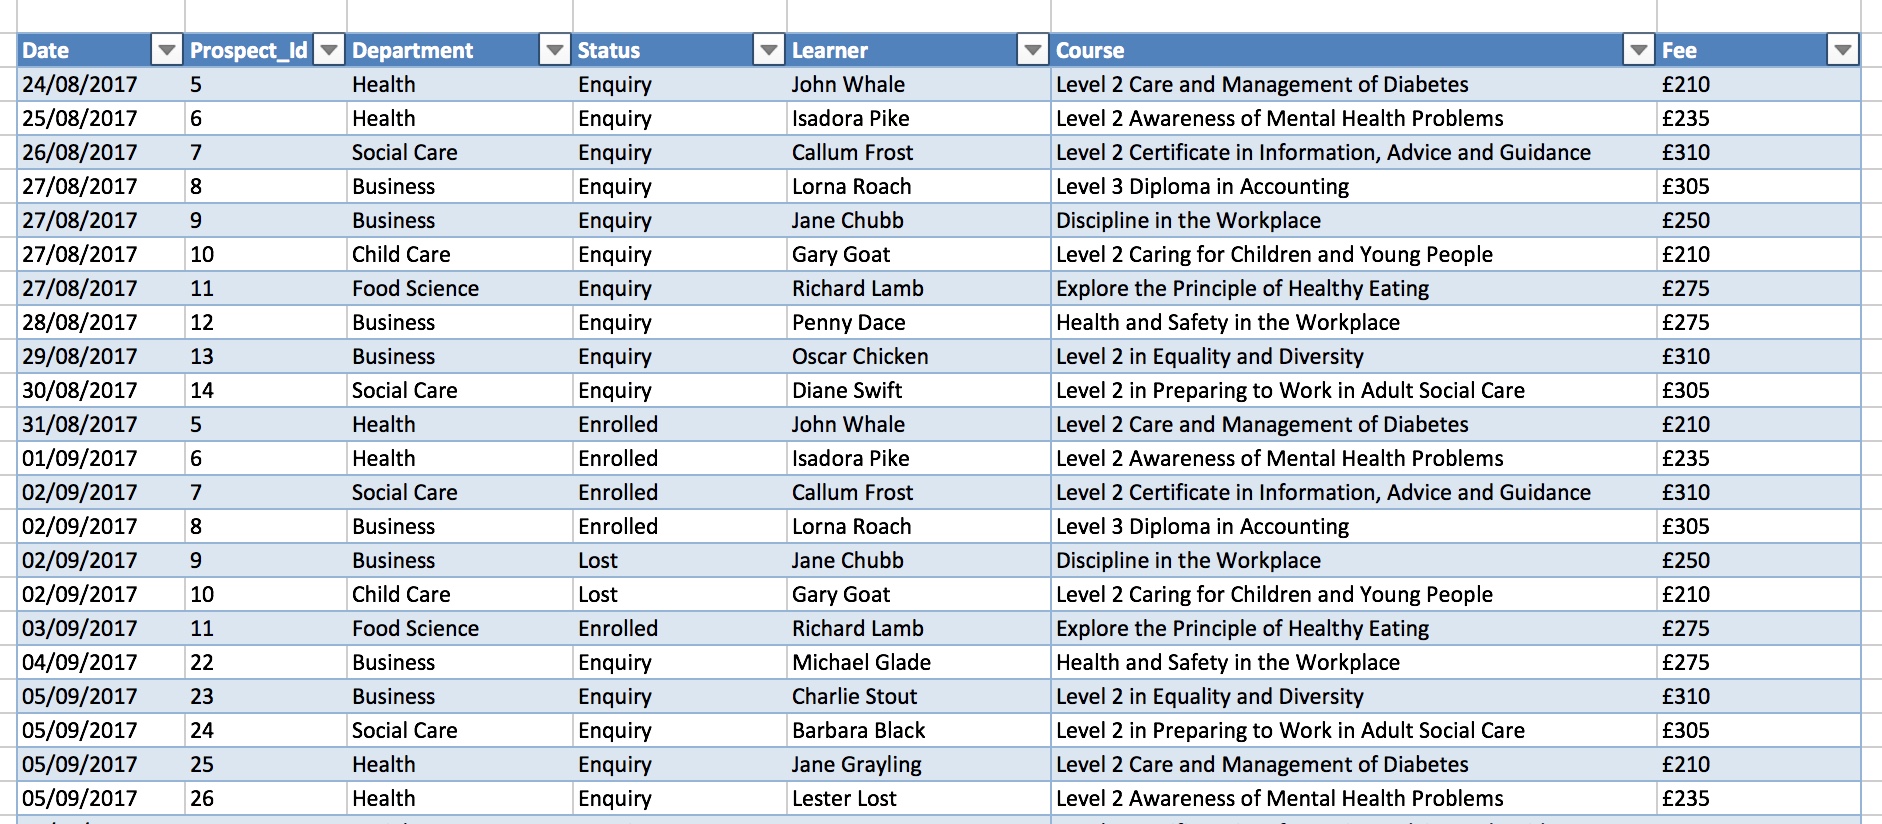
The table also contains the course Fee - and it’s the total fee that I want to show as a running or cumulative total. I want a measure that calculates the total value the enquiries at each date. When I’ve got that it’s then easy to create almost identical measures for the total value of the enrolments and total value of the ‘lost’ opportunities.
This is the measure:
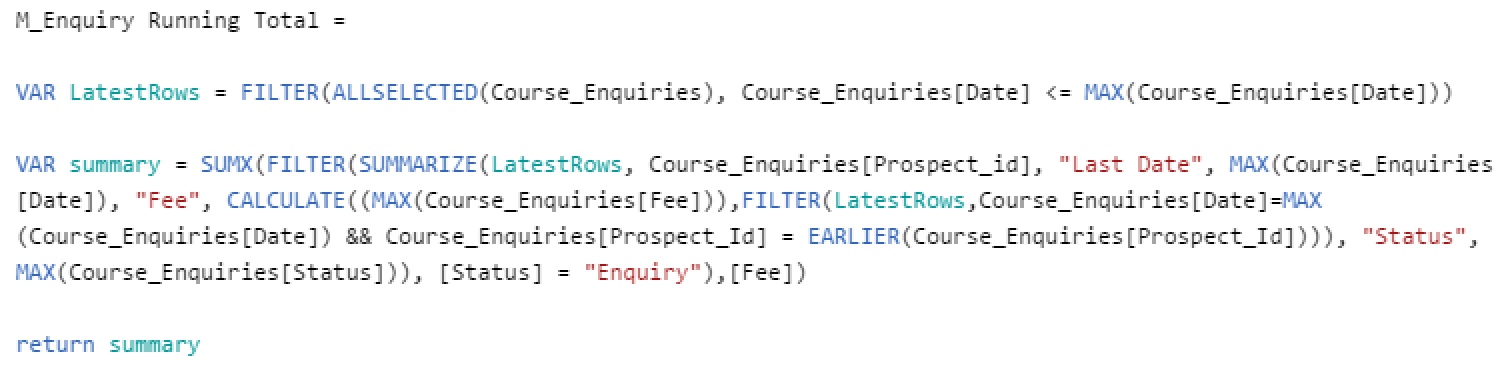
The first thing I do is grab all the rows up to and including the date of the current row. That filtered set of rows is assigned to the variable LatestRows.
VAR LatestRows = FILTER(ALLSELECTED(Course_Enquiries, Course_Enquiries[Date] <= EARLIER(Course_Enquiries[Date])))
That’s almost the same as the calculated column version of the measure except that I’ve used the ALLSELECTED() function.
Next, I pass the LatestRows table into the SUMMARIZE() function to create a summary table where each row is a different Prospect_Id - so I'm really doing a GROUP BY on Prospect_Id.
I want that summary table to show the most recent row for each Prospect_Id. The columns for the summary table are ‘Prospect_Id’, 'Fee' and 'Status'.
This is the DAX that gets the 'Fee' for the summary table:
CALCULATE((MAX(Course_Enquiries[Fee])),FILTER(LatestRows, Course_Enquiries[Date]=MAX(Course_Enquiries[Date]) && Course_Enquiries[Prospect_Id] = EARLIER(Course_Enquiries[Prospect_Id])))
In the expression above I filter LatestRows so that I get the most recent row where the Prospect_id is equal to the Prospect_Id of the current row in the table that's being created by the SUMMARIZE() function. The key to this is the EARLIER function - we loop through the rows in LatestRows looking for rows where the Prospect_Id matches the Prospect_Id of the outer loop - the id of the current row in the summary table that we are building:
FILTER(LatestRows,Course_Enquiries[Date]=MAX(Course_Enquiries[Date]) && Course_Enquiries[Prospect_Id] = EARLIER(Course_Enquiries[Prospect_Id]))
The last 2 parameters passed to the SUMMARIZE() function are 'Status' and MAX(Course_Enquiries[Status]) - we’re simply getting the status ('Enquiry', 'Enrolled' or 'Lost') of the most recent row for the Prospect_Id we are currently interested in.
That's the hard part done. Now I pass my summary table - the table that's returned from SUMMARIZE() - to SUMX(). I filter the table on [Status] = 'Enquiry' and use SUMX() to return the sum of all the amounts for the rows up to and including the date of the current row.
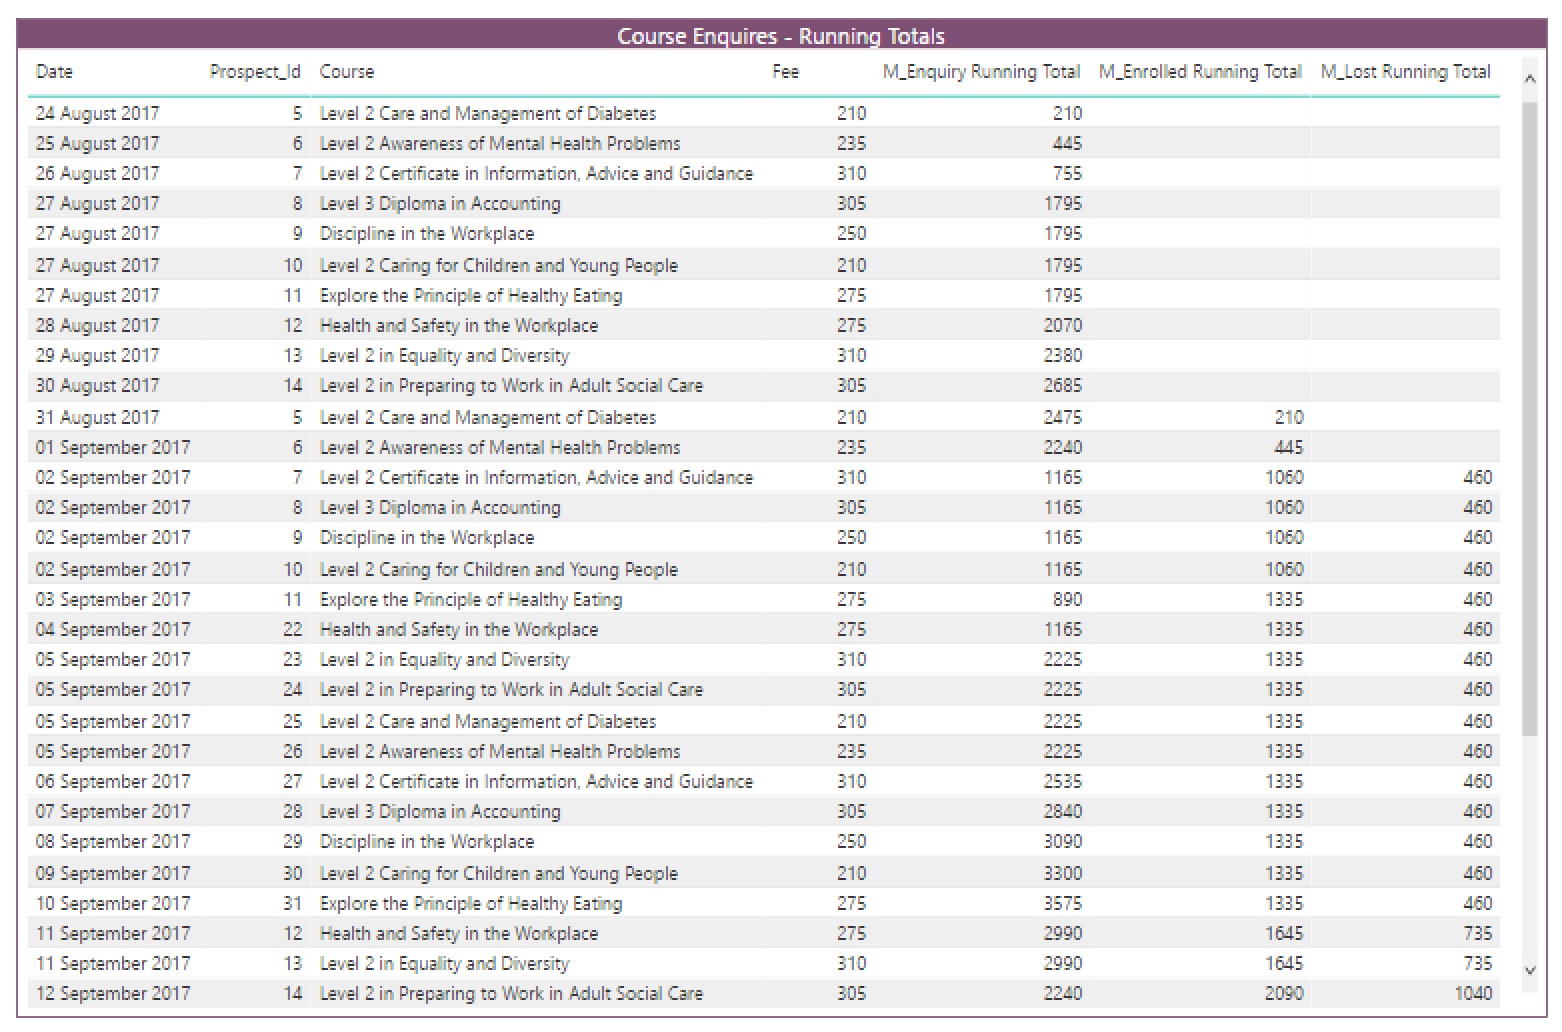
This is the end result - a chart that shows how the enrolment pipeline changes over time. The chart also shows the running total of prospects won and lost. Again, both are measures and they both use almost identical DAX expressions to M_Enquiry Running Total though with a final filter on 'Enrolled' or 'Lost' instead of 'Enquiry'.
Related Posts
Power BI in schools - a student performance dashboard
What's the difference between measures and calculated columns in Microsoft Power BI?
Power BI in schools - a simple way to look at student attainment
Power BI in schools - prototype dashboards with MS Excel
Visualising school performance in Microsoft Power BI
Looking for insights - Pearson Correlation and measures in Microsoft Power BI
Slicer visualization in Power BI - filtering by date with help from a simple measure