Looking for insights - Pearson Correlation and measures in Microsoft Power BI
The scatter chart in the last Power BI blog post is nice but it doesn’t tell you everything you need to know about the relationship between % free school meals and GCSE performance at the end of Key Stage 4.
It seemed like a next step might be to calculate the Pearson correlation coefficient for the GCSE results/free school meals data.
The correlation coefficient is a number between 1 and -1 that indicates the strength of the relationship between the two sets of data. A coefficient of 1 means a strong positive relationship - the two values increase together. A coefficient of -1 is a strong negative - as one value increases, the other decreases.
I used a Power BI measure to do the calculation. This is a good example of when to use a measure - we want the coefficient to be recalculated when filters are applied to the data. Selecting a region and/or local authority changes generates a new correlation coefficient.
The standard formula for the Pearson correlation coefficient is:
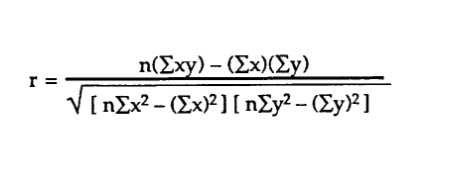
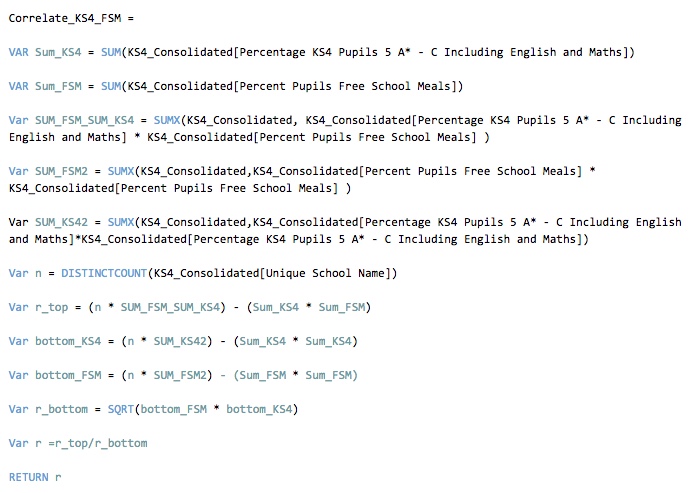
And here’s the DAX for the measure. It’s a straightforward translation of the formula into DAX:
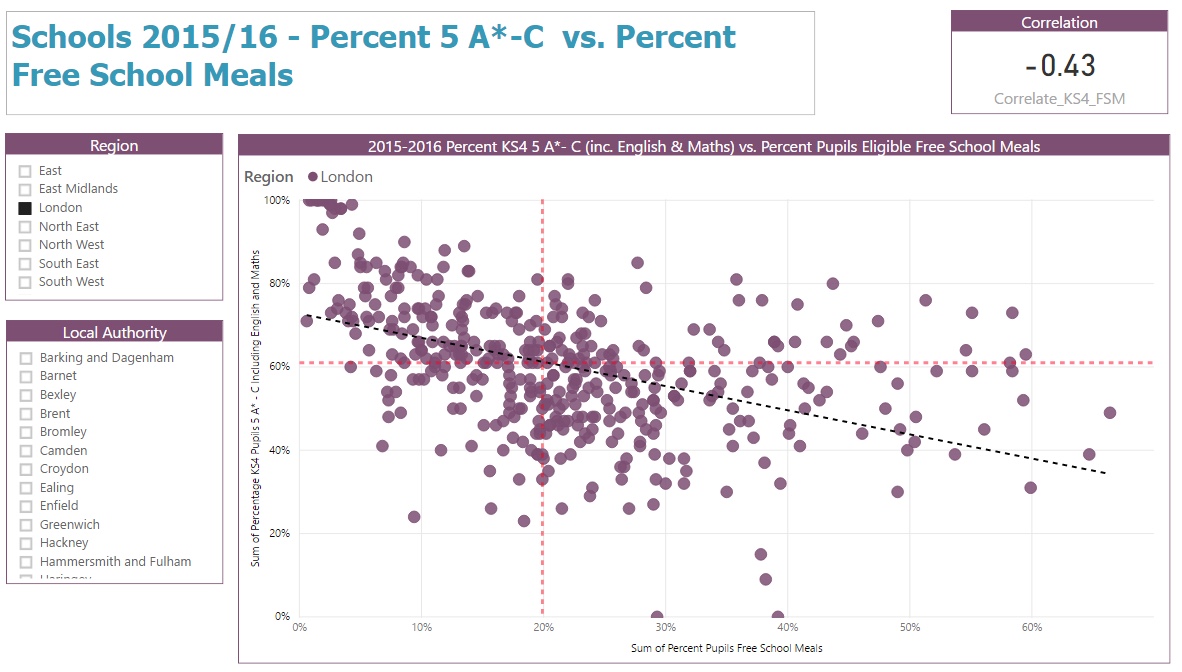
The region and local authority slicers on the report make is easy to compare schools in different parts of the country.
In London the correlation coefficient is -0.43 - there’s a relationship between exam results and free school meals but it’s not particularly strong:
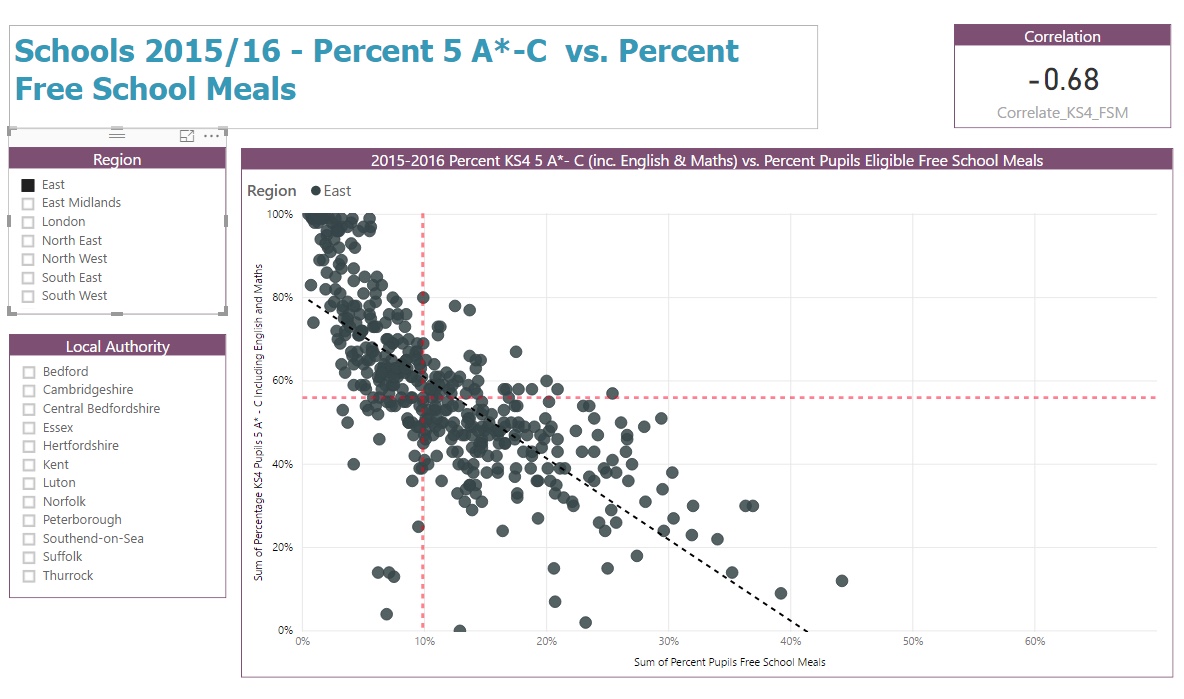
East of England is slightly different - now we’ve got a coefficient of -0.68, a much stronger association that suggests exams results are more likely to go down as the percentage of pupils with free school meals increases:
There are a couple of other points worth noting. Firstly, correlation doesn’t imply causality - we can’t assume that in schools in the East of England the exam results are determined by the percentage of pupils who get free school meals. Secondly, the Pearson correlation coefficient doesn’t care which variable is the independent variable and which is the dependant variable - we get the same answer if we swap the data round and plot results on the X axis and free school meals on the Y axis.
Related Posts
Power BI in schools - a student performance dashboard
What's the difference between measures and calculated columns in Microsoft Power BI?
Power BI in schools - a simple way to look at student attainment
Power BI in schools - prototype dashboards with MS Excel
Visualising school performance in Microsoft Power BI
Slicer visualization in Power BI - filtering by date with help from a simple measure