Power BI in schools - a simple way to look at student attainment
This is one way of looking at student performance in Power BI. It’s a simple report built on top of single table of data about students and how they score in assessments.
Three things about the dashboard are worth noting:
-
It’s designed to answer a single question - how well are our students doing? Some thought has gone into the layout of the dashboard. The visualizations are simple and it is very easy to use.
-
The data behind it is also deceptively simple - a single Excel table of dummy data.
-
It uses some basic ‘Measures’ - custom fields in Power BI that you add to the visualizations in your report. The measures do some extra work with the data. They’re not complicated but they are an extra step that requires a bit more Power BI expertise.
Here's a screen shot of the dashboard:
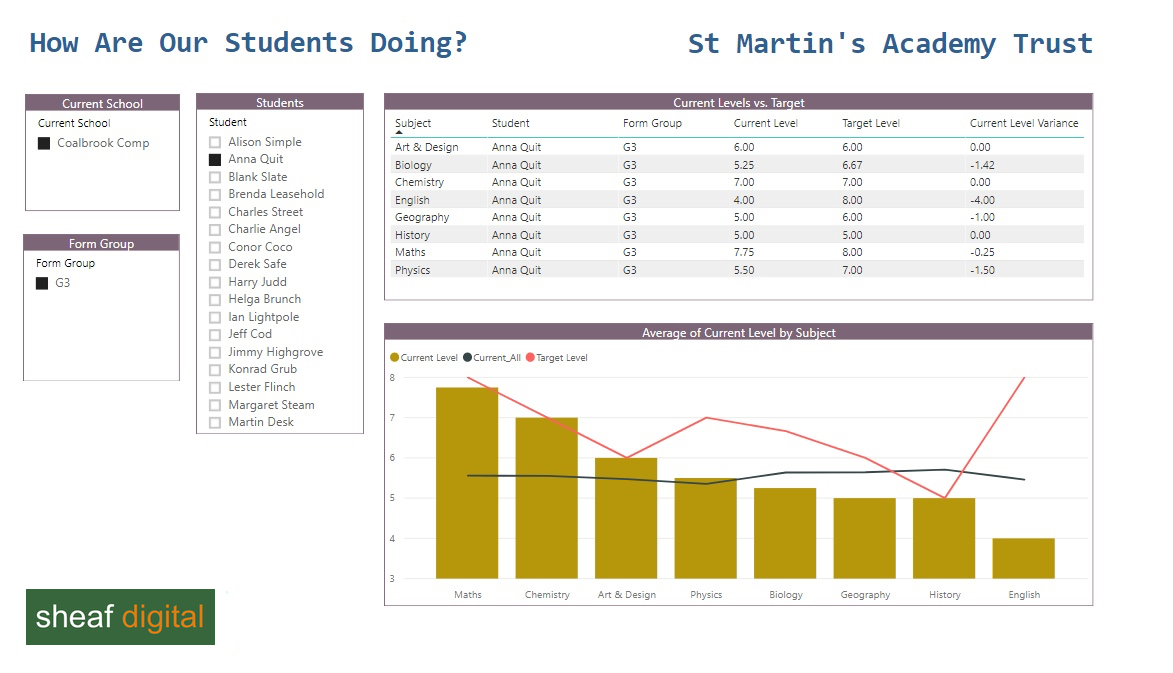
You pick a school in your MAT, you pick a form group and then you pick a student.
The bar chart shows the student’s current performance in each subject. It also shows (the red line) the student’s most recent target in each subject. And, the black line is the average performance of everyone in the form group - so you can see how the student compares against their classmates.
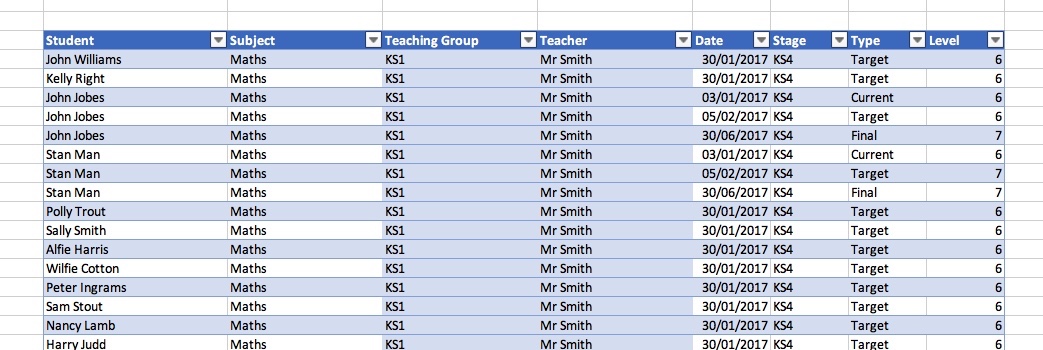
This is the data that drives the dashboard - a single flat table of assessment information.
The measures are a little bit more involved. Here’s the measure that gets the average current attainment of everyone in the group. Measures are created with DAX - Microsoft’s expression language.

The lesson from this example is about the shape of the underlying data - the Excel table that is imported into Power BI. Each row in table is either an actual assessment level or a target level.
Power BI in Schools
Our bespoke support and training for schools and MATs that want to leverage the full potential of Microsoft Power BI.
Each row has also got a date - so we could look at trends over time. And we’ve got teacher names, so we could look at student performance for different teachers if we wanted to. For most schools, the single biggest part of the job will be to get the data out of the MIS in the right format.
Related Posts
Why data analytics with Microsoft Power BI might just be great for your school
A first look at the UK HE longitudinal education outcomes dataset with Microsoft Power BI
Power BI in schools - a student performance dashboard
What's the difference between measures and calculated columns in Microsoft Power BI?
Slicer visualization in Power BI - filtering by date with help from a simple measure