School Data Dashboards
School analytics made easy
No more data silos or messy spreadsheets.
Bespoke, interactive data dashboards that can be shared with colleagues and other school stakeholders.

School data dashboards that help you make better decisions
Track student progress, monitor attendance, spot trends and identify areas for improvement.
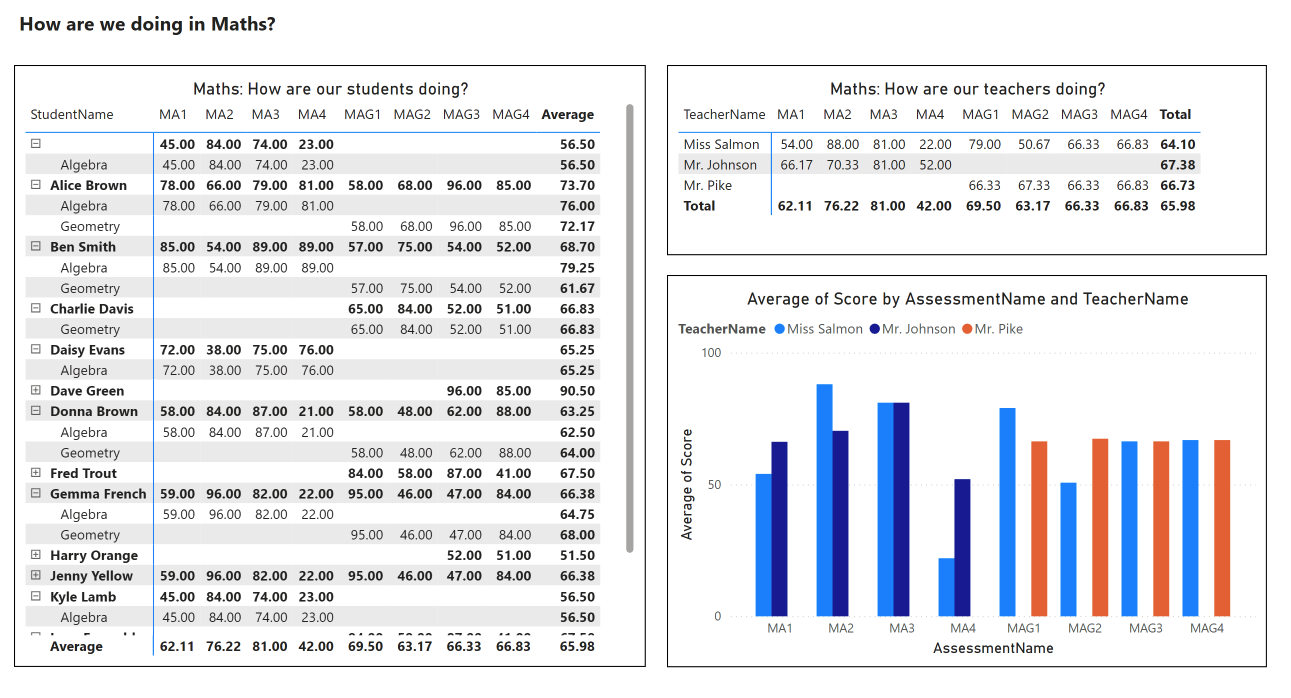
Simplify assessment data
Make it easier to spot students who need extra support.
- Dashboards can completely remove the need for copying and pasting between spreadsheets.
- Student level data can be formatted to highlight those who are falling behind.
- Assessment data can be displayed as simple, interactive dashboards that makes easy to compare teaching groups, schools and past cohorts.

Monitor student attendance
Compare attendance across schools and year groups
- See attendance, absence and persistent absence rates at a glance.
- Quickly spot patterns in student absence - for example, is attendance lower in certain year groups or schools?
- Filter by student demographics - for example, is attendance lower for students with SEND?

Understand student demographics
Dashboards that make it easier to find actionable insights.
- MATs can see how groups of students are perfoming in different schools
- EAL, PP, SEN and other groups can be compared to the rest of the cohort.
- High performings schools can be identified and used as a model for improvement.

Spot trends across time
Time based data can be analysed in different ways.
- Compare trends over time - for example, how has attendance changed over the last 3 years?
- Filter by demographics - for example, how has persistent absence for SEN vs. Non-SEN students changed?
- Data from systems like Arbor and Bromcom can be used to create time based reports.
Data Dashboard Customers
Our customers include individual schools, MATS and international schools.

Why build school data dashboards with Microsoft Power BI?
Schools and MATs are data rich and time poor. And like a lot of organisations, schools struggle to report on data that is spread across different systems:
- School data sits in silos - sometimes even when the same MIS is used in different schools in a MAT.
- Busy staff spend too much time copying and pasting between spreadsheets.
- Reporting on near real-time data - attendance data for example - is difficult.
- Static, non-interactive reports - sometimes shared as .pdf files - make it hard to find useful insights.
Microsoft Power BI is the right data dashboard solution for schools because:
- It is an industry standard solution - it's well supported, gets regular updates and new features.
- There are Power BI data connectors that talk to different data sources - including data warehouses used by MIS vendors like Arbor and Bromcom.
- Power BI Desktop - the report authoring software - is free.
- The online Power BI service solves the school data sharing challenge. Interactive dashboards can be shared with individual teachers, senior teams and other stakeholders.
- Reports and dashboards can be configured to update automatically.
Finally, there’s another reason to develop data dashboards with Power BI - you can build in-house Power BI expertise. Sheaf Digital develops school data dashboards, but we also train educators - we have a series of Power BI training courses for schools, colleges and other education providers.
Power BI Data Dashboard Projects

Microsoft Power BI Training and Consultancy - Brigantia Learning Trust
Sheaf Digital recently delivered 2 days of Power BI Training to staff at the Brigantia Learning Trust in Sheffield. The trust operates 4 academies including one post-16 college....
More
Power BI Consultancy for Schools - St Francis and St Clare
Sheaf Digital has developed a series of Power BI reports for the St Francis & St Clare Catholic Multi Academy Company (SFSCMAC) in Wolverhampton.
More
Power BI Assessment Tracker Reports for the Holy Cross MAC in Coventry
Sheaf Digital has developed a series of Power BI assessment reports for the Holy Cross Multi Academy Company in Coventry. The 5 Holy Cross primary schools use the Arbor school management information system....
More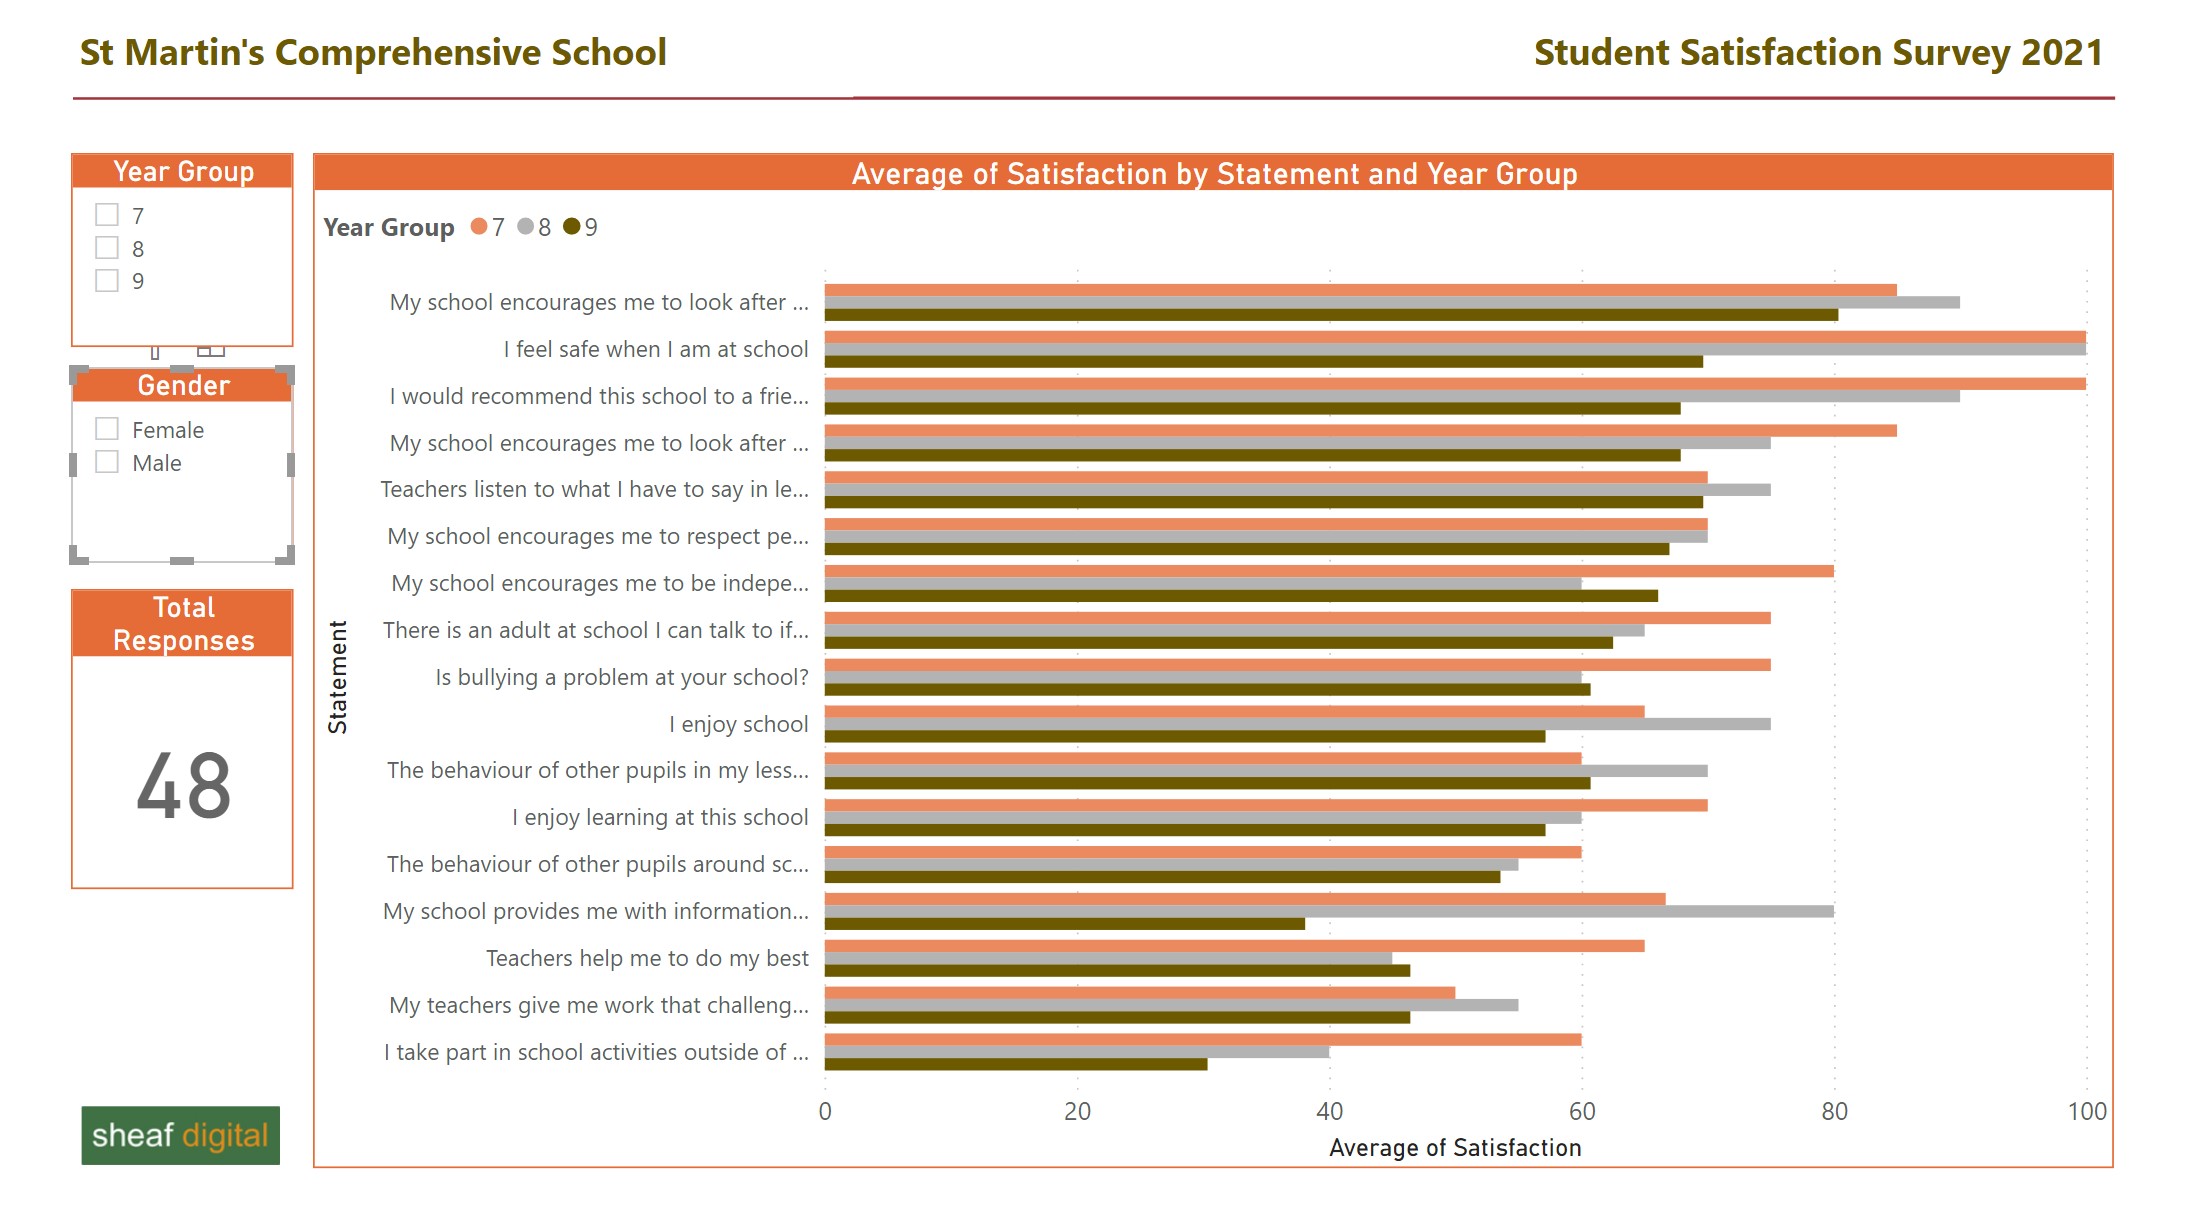
A Simple Guide to Microsoft Power BI in Multi-Academy Trusts and Schools
Multi-academy trusts (MATS) face particular challenges when they try to collect, organise and then report on data....
More
How to use Data Dashboards in Schools to Improve Student Attendance
Good decisions start with good data and even a simple dashboard can tell you a lot about patterns in attendance, trends over time and how different schools and groups of students within schools compare to each other....
MorePower BI in schools - a student performance dashboard
This is another look at how you could build a very simple Power BI report to track student performance. There are two tables of data – both imported into Power BI Desktop from an Excel Workbook. Power BI Desktop automatically joins the two tables on StudentId...
MoreHigh Quality Microsoft Power BI Training Courses
Find out how to build and share reports. Courses for complete beginners take you through data preparation, data loading, report design and basic calculated columns and measures. Bespoke courses can use your own data.