How to create a line graph in Chart.js with dynamic data
How do you create JavaScript charts with the chart.js library that use data from a database on a server?
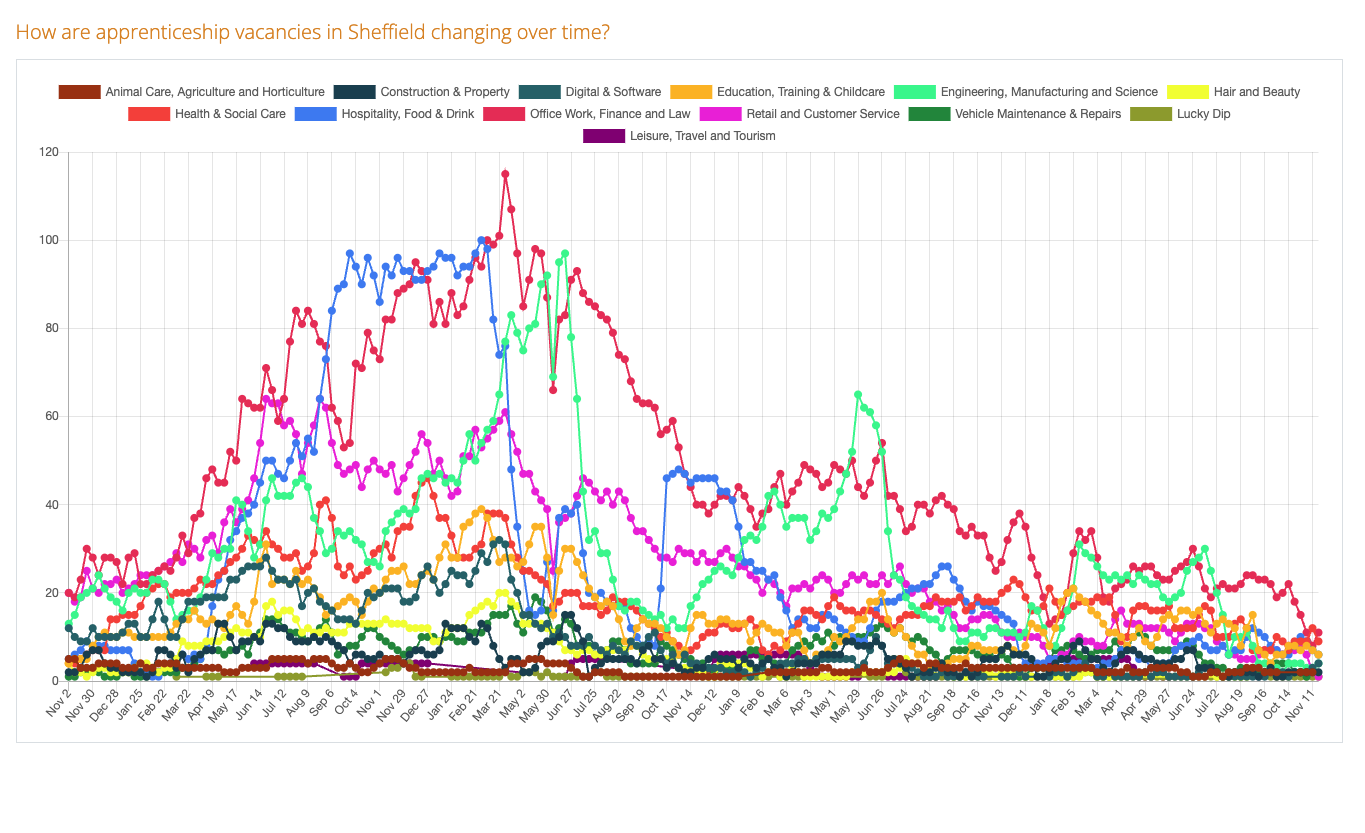
We use chart.js to display data about apprenticeship vacancies Sheffield. Each day we get the data from the gov.uk apprenticeship service API. The data's saved to a database and then used to build a chart that shows how the number of apprenticeship vacancies in each category is changing over time.
How do we get data from the server into the Javascript that creates the chart in the user’s browser?
Server side PHP - converting arrays into JSON
There’s a simple PHP script that gets two arrays of data from the database - the apprenticeship types and the daily count of vacancies in each type.
Both arrays are added to a new array and then converted to JSON.
$typecounts = $apprenticeship->getJobCategoriesByDate($postcode);
$types = array_unique(array_column($typecounts, 'name', 'colour'));
echo(json_encode(array($typecounts, $types)));
Getting the data from Javascript
We use XMLHttpRequest to run the PHP script and fetch the data. The code’s straightforward but there’s an extra step. For some reason the types come back as an array of objects. We loop through that array, converting each object to an array of properties. These arrays are then added to the types array.
var req = new XMLHttpRequest();
req.onload = function(){
   data = JSON.parse(this.responseText); typecounts = data[0];
   for(var i in data[1])
      types.push([i, data[1][i]]);
   setupChart();
   };
req.open("get", "http://sheafdigital.test/sandbox/apprenticeships-in-sheffield-chart", true);
req.send();
Setting up the chart
setUpChart is where most of the work happens. It’s called in onReq.onload when our Javascript request to the PHP script returns with some data.
There’s a lot of looping through arrays in setUpChart to get data into the format we need for the chart. In the end we want two arrays of data that we can use to initialize the chart:
-
An array of labels - labelvals.
-
A multidimensional array of counts data - 1 set for each type of apprenticeship - datasetvals.
This is what happens in setUpChart:
-
We create our labelvals array of unique dates.
-
We loop through the types. For each type we find all the daily vacancy counts and copy them into a new array called countsfortypes. We then use countsfortypes to create a dataset object for the type. Each dataset object - one for each type of apprenticeship - is added to datasetvals.
-
Finally we create a new chart variable and set the options in its constructor.
function setupChart(){

	var labelvals = [];
	var datasetvals = [];
	var i = 0;
	var flags = [];

	//go through and create array of dates - just get unique dates
	for(z=0;z < typecounts.length;z++){
		if(flags[typecounts[z]["created"]]) continue;
		flags[typecounts[z]["created"]] = true;
		labelvals.push(new Date(typecounts[z]["created"]));
	}

	//go through and create our datasets
	for(z=0;z < types.length;z++){
		countsfortypes[z] = [];
		//get the counts for each type
		for(x=0;x < typecounts.length;x++){
			if(typecounts[x]["created"] && typecounts[x]["name"] == types[z][1]){
				countsfortypes[z].push(
					{
						t: new Date(typecounts[x]["created"]),
						y: typecounts[x]["total"]
					}
				);
			}
		}
		//ceate dataset object and add to datesetvals array
		datasetvals.push(
			{
				label: types[z][1],
				borderWidth: 2,
				lineTension:0,
				fill: false,
				pointBorderWidth: 2,
				pointRadius: 3,
				pointBackgroundColor:types[z][0],
				pointBorderColor:types[z][0],
				borderColor: types[z][0],
				data: countsfortypes[z],
			}
		);
	}

	//labels and data - ready for chart
	var dataTypesTime = {
		labels: labelvals,
		datasets: datasetvals
	};

	//create the chart
	var chart = new Chart(ctx, {
		type: 'line',
		data: dataTypesTime,
		options: {
			reponsive: true,
			maintainAspectRatio: false,
			legend: {
						display: true,
					},
			scales: {
				xAxes: [{
					type: 'time',
					time:       {
						displayFormats: {
							day: 'MMM D'
						},
						tooltipFormat: 'DD/MM/YY',
					},
					distribution: 'series',
					bounds:'data',
				}]
			}
		}
	});
}
Mobile Support
One thing we wanted to do was get the chart working on a mobile device. It's a complicated chart and and it's always going difficult to read on a phone, but it can be made more or less usable. To make it work on a mobile device we had to:
-
Set a minimum height on the chart with an inline style.
-
Set 'responsive: true' and 'maintainAspectRatio: false' in the options when we create the chart in setUpChart.
Related Posts
How to automatically backup a PostgreSQL database to Microsoft Azure
React Native and Bluetooth - Discovering Services and Characteristics and Reading Data
Sheffield Apprenticeships - How to develop an app for Android and iOS with React Native
Simple TCP service with Node.js to capture weight data from wireless weighing scales