Using measures and filters to show two sets of data on a Power BI Radar Chart
The Power BI Radar Chart is a nice way to show how a set of values varies across multiple categories. And you can add further sets - so one radar chart shows two or more sets of values against the spokes. You then see at a glance how the different sets of values compare.
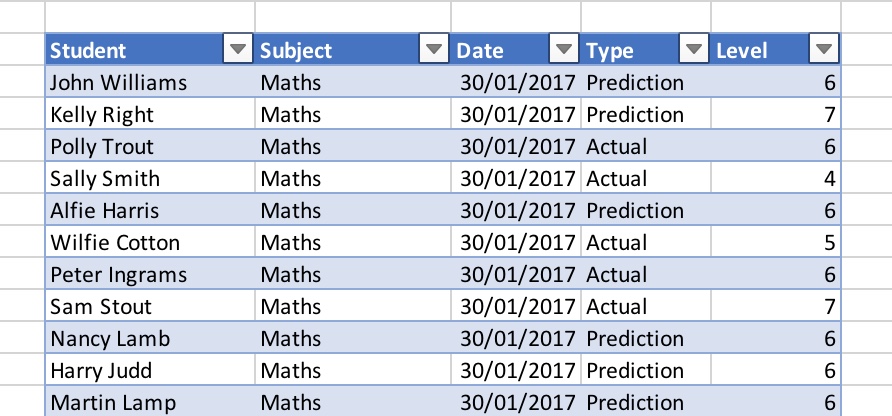
I used the radar chart to compare ‘predicted’ and ‘actual’ attainment levels in different subjects for school students. The table of sample data is shown below. The attainment levels are in one column and the type - ‘Predicted’ or ‘Actual’ is in another column. I’m interested in the average predicted and the average actual attainment level for each subject category.
Getting the two types of attainment level to appear as two different plots on the radar chart is straightforward. I created two measures:


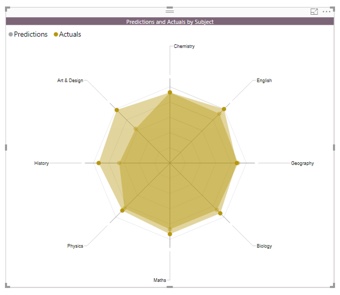
The two measures, ‘Actuals’ and ‘Predictions’, are then used on the Y Axis within the Fields section of the Visualizations panel. The ‘Category’ field is set to ‘Subjects’. Here is the resulting radar chart:
The measures are simple - a good introduction to anyone who wants to start to do more with Power BI.
Related Posts
Why data analytics with Microsoft Power BI might just be great for your school
A first look at the UK HE longitudinal education outcomes dataset with Microsoft Power BI
Power BI in schools - a student performance dashboard
What's the difference between measures and calculated columns in Microsoft Power BI?
Slicer visualization in Power BI - filtering by date with help from a simple measure