
Power BI and iSAMS - Simplified Assessment Tracking for LVS Ascot
How do you simplify student assessment reporting across Y7 - Y13 when one academic year’s worth of data is almost 50 spreadsheets? And at the same time you want to create a solution that works across previous academic years, so you can use the data that’s archived in dozens of older spreadsheets to analyse trends over time?
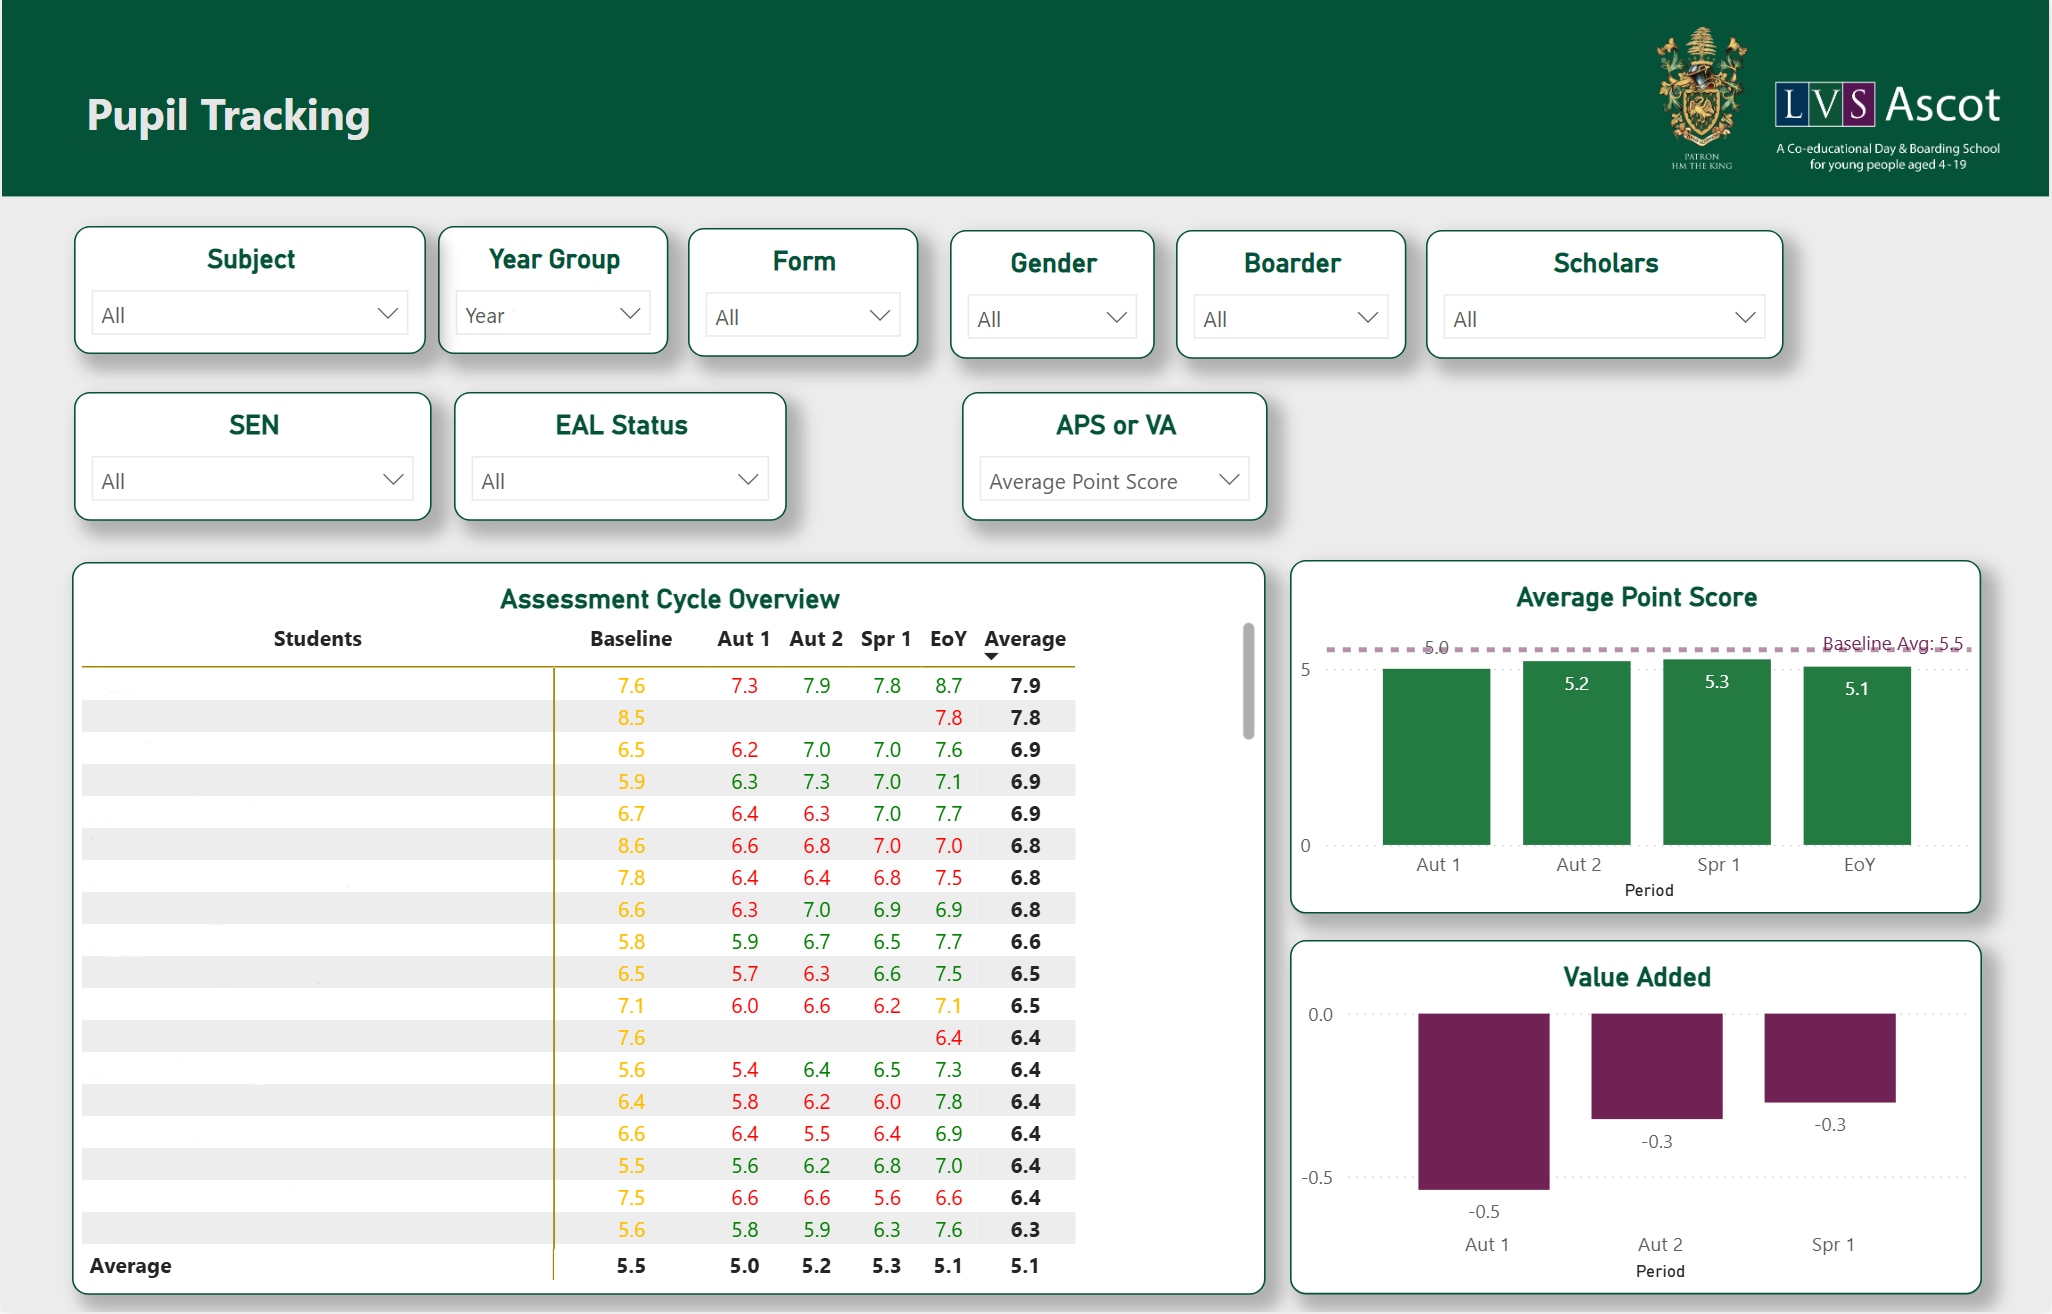
LVS Ascot asked Sheaf Digital to work with them to build a solution with Microsoft Power BI. The school wanted a super simple, teacher-friendly report that would update automatically and be completely aligned with their current approach to student assessment.
What they needed
The basic requirements included:
- The report works for Y7 - Y13.
- Cover all assessment cycles - twice a term teacher assessments, exam mocks and final GCSE & A Level results.
- Allow quick and easy comparison between assessment cycles, subjects, students etc.
- Include measures to calculate average point scores, value added, comparison with baseline predictions etc.
And of course, the report has to refresh automatically when new assessment data becomes available, require very little ongoing maintenance and be easy to use - most teachers need zero (or at least very little) training.
What made this one interesting?
Like other private schools, LVS Ascot uses the iSAMS management information system. Some of the data came directly from the iSAMS Snowflake data warehouse - this was the easy part. The hard part is the assessment data. That comes from multiple Excel spreadsheets - up to 7 spreadsheets per year group per academic year; almost 50 spreadsheets per academic year.
What were the big challenges?
Challenge 1 - The Spreadsheet Avalanche
How do we create a solution that will import almost 50 spreadsheets per year? The imports have to be automatic - each spreadsheet is dropped into a folder, Power BI does its refresh, picks up the new spreadsheet, processes the data and adds it to its ASSESSMENT table.
The solution comes in two parts. Assessment spreadsheets are dropped into a shared SharePoint folder at various points during the year. Power BI is configured to see that folder. New spreadsheets are imported and a script reads the contents of the file, simplifies data and unpivots multiple subject columns - flattening complex tracking spreadsheets into a clean, uniform timeline that Power BI can read instantly.
Challenge 2 - Trends over Time
How do we support previous academic years? We had the assessment spreadsheets from earlier years and the iSAMS Snowflake database tells us who is enrolled in the current academic year, but linking the two so we can start to look at trends over time is tricky.
We needed an YEAR_GROUP_ENROLMENTS table - a record per student per academic year that tells us exactly who was in each year group in previous years.
The solution was to generate the table using birth dates. We know when a student joins the school, we know if they’ve left and using the birth date we can calculate who was in each year group in each academic year. That's important because we want the report to show historical data - average subject scores in earlier years, performance of different demographic groups over time etc.
Challenge 3 - When Birth Dates Don’t Match
This challenge emerged after we’d created our YEAR_GROUP_ENROLMENTS table. In reality, there are a few students in year groups that don't correspond to birth dates - so a student who you think should be in Y11, but they’re actually in Y10.
Again, SharePoint was the solution. We now have a corrections spreadsheet. When we spot students who are not in the year group predicted by birth date, we add them to the corrections spreadsheet. Power BI picks up that spreadsheet during refresh and then ‘fixes’ the year group enrolment record for each student.
What are the benefits?
-
Time saved. There’s a huge amount of process that used to be done by hand and that is now automatic. That is a significant time saver. It’s not unreasonable to say it’s saved days of staff time over an academic year.
-
There’s an unavoidable focus on data quality during the report development. That’s a good thing - spotting, explaining and fixing where necessary differences between student data in the assessment spreadsheets and student data in iSAMS. And it encourages a discussion across academic departments about consistency - how assessment data is recorded.
-
Subtle but important cultural change - assessment data is easier to share and colleagues can now get a better view of student performance across all subjects. The focus can shift to using the data in a different way - encouraging more discussion about individual student performance across subjects and differences between groups of students within the same subject.
Conclusion
What Sheaf Digital developed for LVS Ascot solves a problem we see across schools, regardless of the MIS. Assessment data lives in spreadsheets. Reporting depends on someone who knows where all the spreadsheets are and how to stitch them together - someone who’s often working in the evenings or during the holidays because it takes more time than they have during the working day.
Year-on-year comparisons are often possible, but rarely worth the pain of pulling them together. And the staff who benefit most from looking across subjects or cohorts don't always do it because getting to the answer is too difficult.
The interesting thing really isn't automation or the other technical stuff that goes into building a report like the one we developed for LVS Ascot. It's what changes when the development stops, the report is shared through the online Power BI service and staff start using it; heads of department asking questions they wouldn't have bothered asking before and conversations about students that can now draw on the full picture rather than one subject's slice of it.
If your school or trust recognises any of this, it's probably worth a conversation.
Power BI in Schools
Our bespoke support and training for schools and MATs that want to leverage the full potential of Microsoft Power BI.
Related Posts
How to use Data Dashboards in Schools to Improve Student Attendance
A Simple Student Assessment Dashboard - Prague British International School